You have likely figured it out — this site is in the making. Please check back regularly to watch as I build it bit by bit.
Introduction
Florida's Gulf Coast is one of the most breathtaking and idyllic regions in the world. Its shoreline is defined by white sandy beaches, warm waters, palm trees, and vast mangrove forests. The central and southern sections, stretching from Marco Island to Clearwater Beach, are particularly renowned for their wide, endless beaches with fine, powdery sand. It's no surprise that some of the most stunning beachfront mansions can be found here.
This paradise comes with its own challenges. Devastating hurricanes make insuring these valuable properties a daunting task. Residents and tourists yet face another, often invisible threat—the very waters they admire so much. Pollutants such as heavy metals, red tide events, and harmful algal blooms (HABs) pose a persistent and growing risk to Florida’s tranquil Gulf Coast.
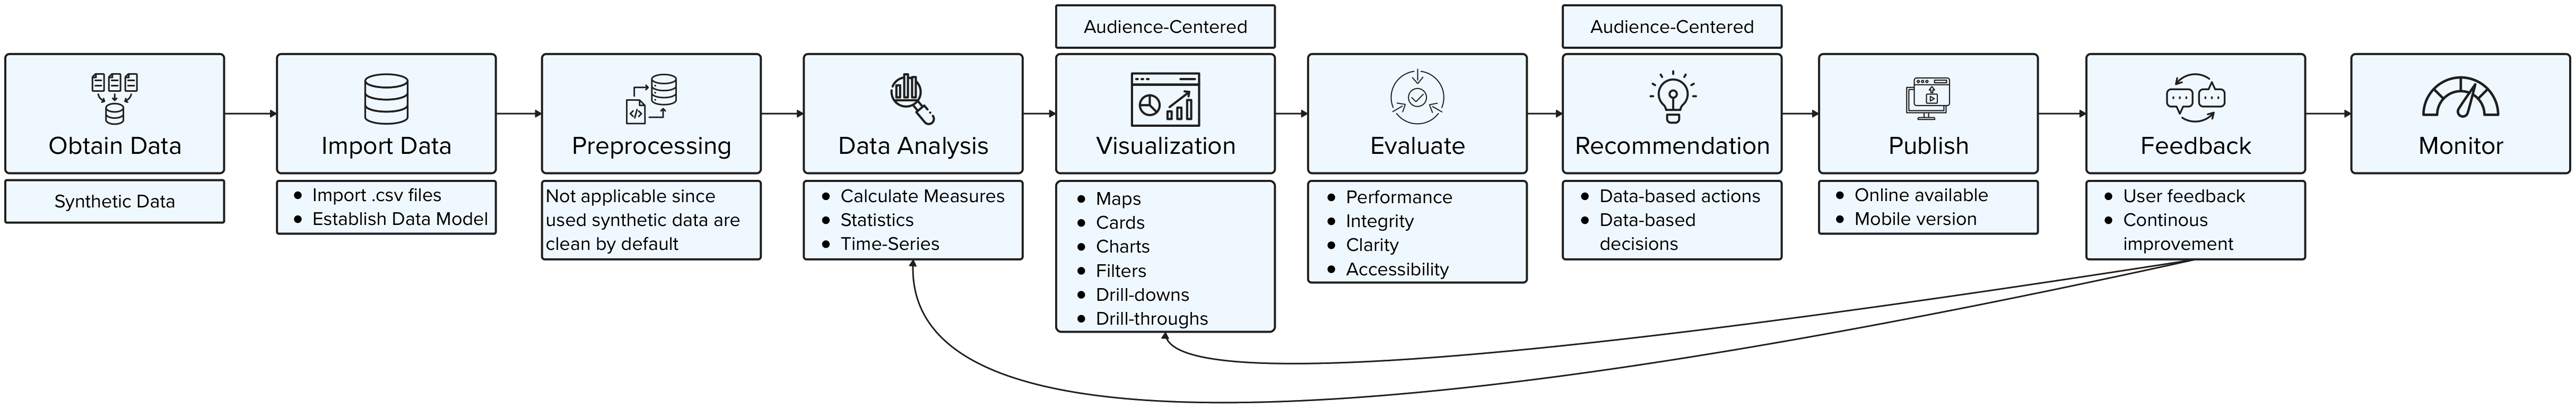
This fictitious project monitors the water quality of Florida's scenic Gulf Coast. The collected data is presented through interactive dashboards and detailed reports published online, providing the public with a clear overview of current water conditions as well as in-depth insights into trends and patterns.
Scenario (fictitious)
In the wake of the devastating phosphate mine leak and sewage spill of 2023, Florida’s Gulf Coast faced an environmental emergency. Toxic algal blooms spread rapidly, and pollution levels spiked, putting millions of residents and visitors at risk. Public concern soared. The state needed answers - fast.
Recognizing the urgency, Florida’s Department of Public Health took decisive action, launching a specialized agency: the Office for Ocean Pollution and Spills, or OOPS. Its mission? To track and mitigate waterborne health hazards before they turned into full-blown disasters. But to do that, they needed real-time data.
ScyllaWorks, a cutting-edge oceanic engineering firm tasked with designing and deploying water quality monitoring stations. Seven key locations were chosen, stretching from Clearwater Beach to Sanibel Island. These stations would monitor and record crucial data on pollution, harmful algal blooms, and other environmental threats.
As Chief Data Analyst, I had a critical role to play. Raw data alone wouldn’t be enough - we needed to make it meaningful. I developed interactive dashboards and reports that transformed complex water quality metrics into clear insights. My goal was to empower communities, environmental groups, and policymakers with real-time information so they could take swift, data-driven action.Scope
Through a comprehensive requirements analysis involving key stakeholders - including public health officials, environmental agencies, and community representatives - we identified the following core requirements for the development of interactive dashboards and reports.
Technology and Platform
- The dashboards and reports will be developed using Microsoft Power BI, leveraging its advanced visualization and interactive capabilities to ensure accessibility and ease of use.
Dashboard Features
- A central dashboard will display a map with the seven monitoring stations, each providing real-time water quality data through gauge indicators that reflect current conditions.
- The dashboard will feature interactive drilldown functionality, allowing users to select a station and access a detailed report with current water parameters. Each parameter will be displayed on a visual scale to indicate whether values are within safe, critical, or hazardous ranges.
Report Functionality
- The detailed reports will allow users to drill through specific parameters, leading to an in-depth view of historical data.
Each parameter's historical report will include
- A Bullet Chart to visualize current paraeter values for each parameter and its description and impact.
- A line plot to visualize trends and patterns over time, aiding in early detection of environmental risks.
- A table of recorded values for transparency and data accuracy.
Disclaimer
The ficticious ScyllaWorks website has been created using Large Language Models (LLMs) showcasing the ability AI has to offer. For transparency, LLMs and prompts used to generate the content can be acessed below.
Data
Water quality data are readily accessible online, with many sources offering free use. However, complying with the policies set by data owners can be challenging,
as these policies can change over time. For this project, it was essential to share both the original data and its derivatives. To ensure compliance with current
and future data policies and to avoid potential violations, I opted to use synthetically generated data.
The Python script used for data generation is provided below and is set up to ensure reproducibility. This means that every time the script is run, the same
synthetic data will be produced.
Data Analysis
Results
Residents can now check the water quality of their favorite beaches before heading out. Even better, they can subscripe to alerts that warn them from unsafe water
quality without checking each time they're heading to the beach. Conservationists use the data to drive pollution mitigation efforts. State agencies
utilize the insights to develop proactive policies, ensuring a healthier future for Florida’s coastlines.
From crisis to control, this was more than just a technological challenge - it was a mission to protect the waters that millions call home. And with data as our guide,
we turned uncertainty into informed action.
Potential Display Issues
In this publicly published dashboard, you may experience certain inconveniences:
- Overview Map The map is shown as a gray square. The map feature is a paid service provided by Power Bi. In my current subscription,
I can use the map feature, however, my subscription does not include public sharing.
Workaround Imagine a beautifully rendered map of Florida's Gulf Coast with seven markers referencing the monitoring localities. When you press a Location Tile to the left of the map, the map zooms into the location.
Alternative: Power BI Desktop (free!), subscribe to Power BI Service, download my Power BI file, and check out the astonishing features hidden in the subscription. - Drillthrough: The drillthrough option allows the user to click on a visual (e.g., gauge or chart) to be forwarded to another report
with more information about the data in the selected visual. Due to the limitations of my subscription, the drillthrough option may not be available.
Workaround: I have implemented page navigation. Select visuals or klick on appropriate buttons for navigation.
Alternative: Download Power BI (free!) and download my Power BI file. Open the file in Power BI Desktop and enjoy the functionalities that come for free.